The pipeline total changes depending on who asks
Sales has one forecast, leadership has another, and the spreadsheet has the number everyone uses anyway. You spend the meeting settling the figures instead of deciding what to do.

HUBSPOT REPORTING DASHBOARDS
Your pipeline meeting shouldn't begin with three people explaining why their numbers don't match. You need to see which opportunities are moving, which need attention and where new business is coming from.
We help Australian teams build HubSpot reporting around the decisions they make each week. That can mean fixing deal stages, lead sources and ownership before we touch the dashboard, then showing the team how to keep its numbers dependable.
CLCK DEMO ACCOUNT · TEST DATA, NOT CLIENT RESULTS
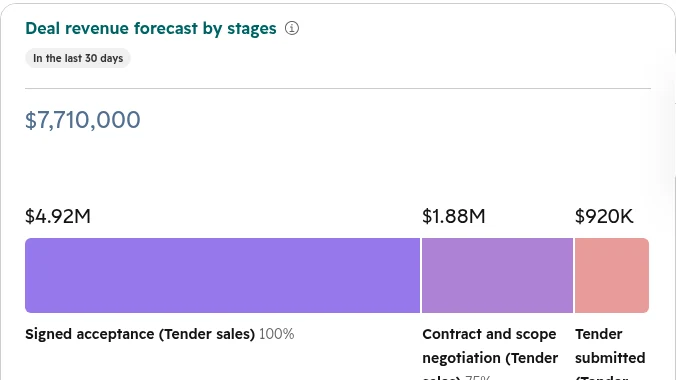
A forecast view can show how much sits in each stage, then prompt the question: are those stages and expected close dates still accurate?
View larger screenshotWARNING SIGNS
The warning sign isn't always a broken chart. Sometimes it's the conversation around it.
Sales has one forecast, leadership has another, and the spreadsheet has the number everyone uses anyway. You spend the meeting settling the figures instead of deciding what to do.
If a person has to tidy exports before the numbers make sense, find out what the spreadsheet is correcting. It may be missing fields, inconsistent stages or a rule the CRM doesn't yet reflect.
Ten charts won't help if the team still can't see which deals are stuck, who owes a follow-up or whether this month's enquiries are becoming sales conversations.
When forms, campaign links, imports and manual records aren't handled consistently, it's hard to tell which work brought an opportunity in. We check what the data can actually support.
SHOW ME THE REPORTS
The sales screens come from our public HubSpot reporting walkthrough; the marketing view was supplied by CLCK for this page. They show the questions you can ask of a dashboard, not results we're claiming for a client.
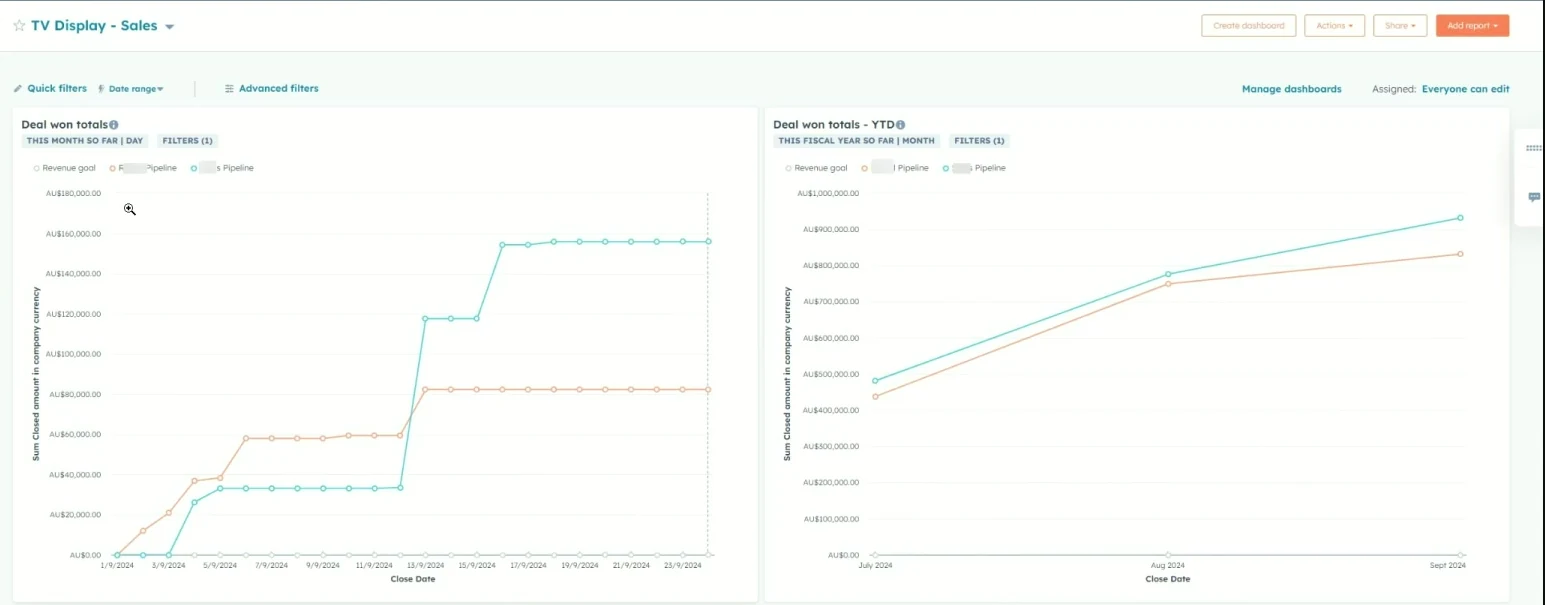
Two views of won deals can prompt different conversations: what changed this month, and how does the year look so far? The answer still depends on deal dates, stages and amounts being kept up to date.
From CLCK's public HubSpot walkthrough. These figures aren't presented as a client outcome for this service.View larger screenshot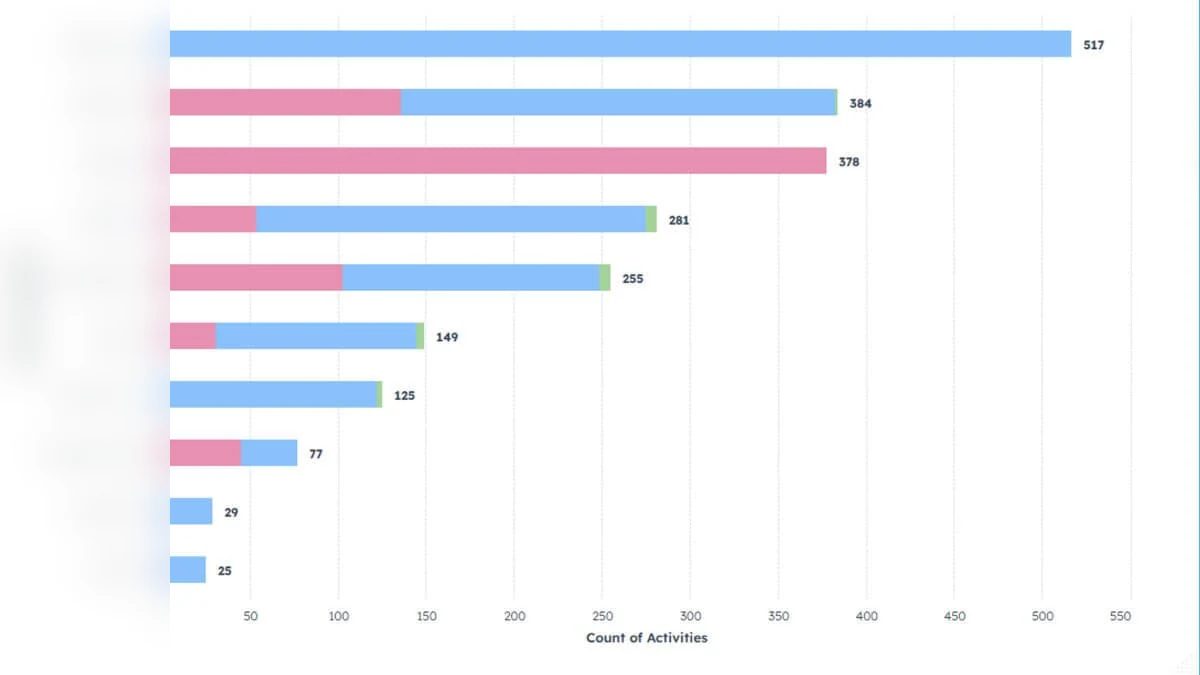
An activity view can tell you what's being logged across the team. It can't tell you whether a call was good or a deal is healthy. Use it to ask better questions, not to turn a count into a verdict.
From the same public walkthrough. We obscured the names before adding it here.View larger screenshot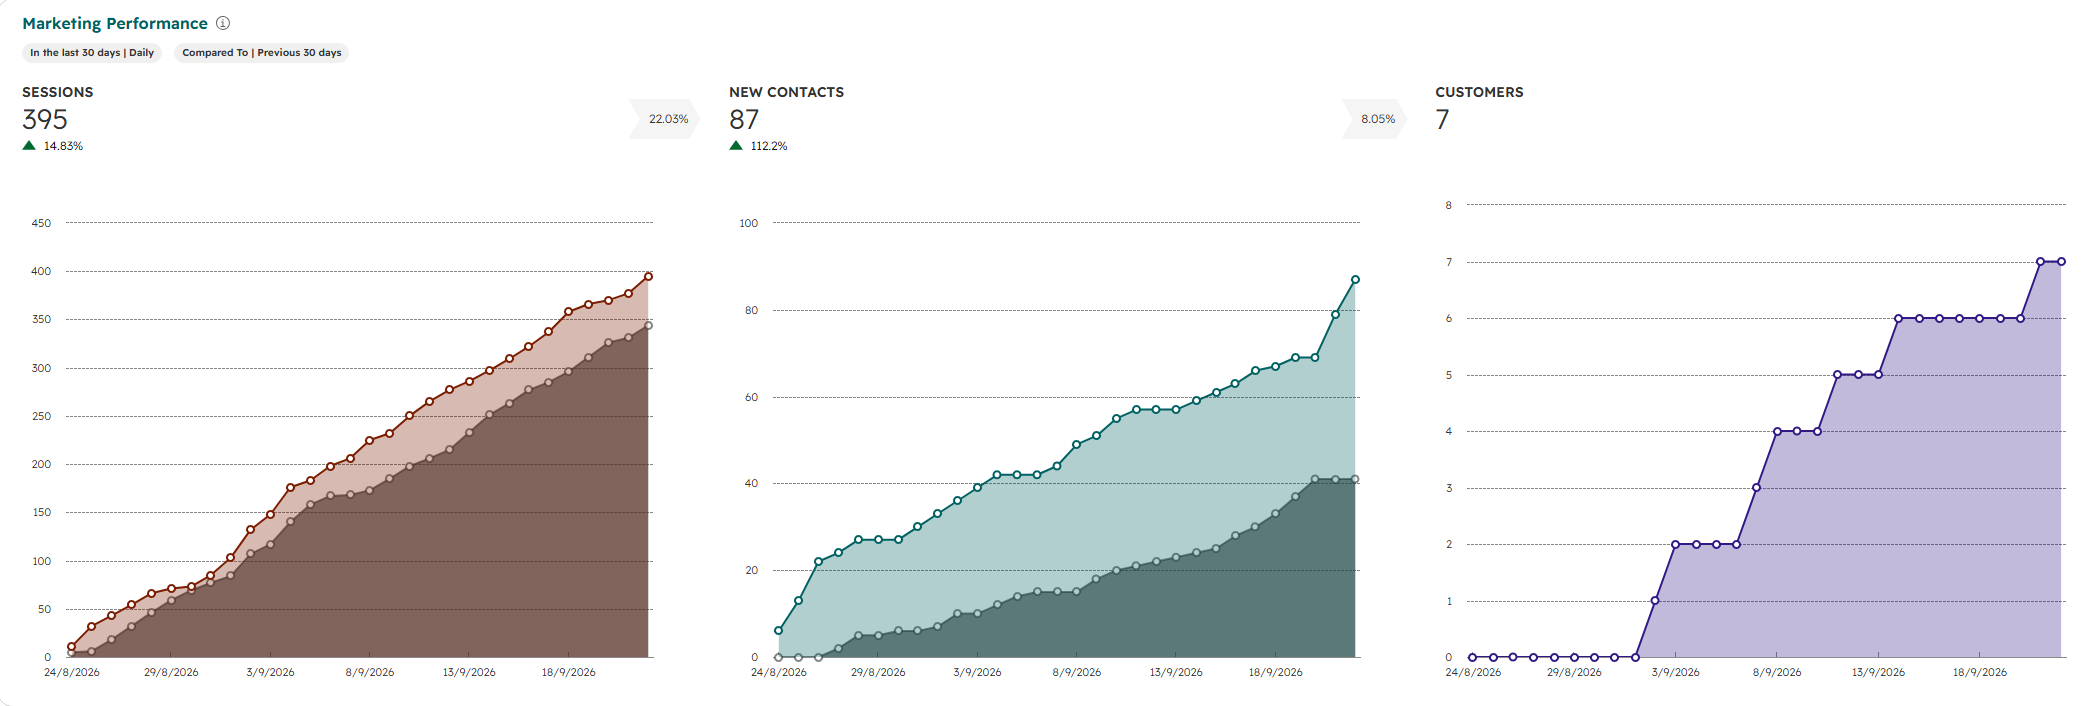
This view puts sessions, new contacts and customers side by side. In a real business, it can send you back to the forms, source tracking and follow-up before you celebrate more traffic.
Screenshot supplied by CLCK for this page. The figures shown aren't presented here as a client case study. On a phone, the same three charts are stacked so you can read each one.View full-size screenshotWHAT BREAKS
Before building more reports, we find the point where a number stops matching what people know is happening.
If lead, marketing-qualified lead, sales-qualified lead, deal and customer mean different things to different people, the conversion report will give you a confident-looking answer to the wrong question.
A stage called 'Proposal' doesn't tell you whether a proposal went out yesterday or has been sitting unanswered for a month. Stage rules, next steps and ownership need to match the real sales process.
Calls, meetings and follow-up may be happening in inboxes or people's heads. Before using activity to judge performance, check what gets recorded, which tools connect and what the team can realistically maintain.
A source chart cannot repair missing history. We look at how forms, imports, campaign links and integrations create records, then decide what can be corrected and what can only improve from here.
If pipeline stages are part of the problem, read how to map HubSpot deal pipelines before building stages.
CLCK APPROACH
Some portals need a few focused reports. Others need the underlying sales process fixed first. We'll tell you which job you're looking at.
What does the sales manager need to decide on Monday? What does marketing need to learn after a campaign? We write down the questions first, then work back to the records and reports needed to answer them.
We check lifecycle and deal stages, sources, owners, required fields and handover rules. The aim is shared meaning: when someone changes a stage, everyone knows what happened and what should happen next.
A sales manager may need stuck deals and next steps. Leadership may need pipeline movement and forecast assumptions. Marketing may need source quality and handover. We build the views around those jobs.
We explain which fields matter, when to update them and who owns a correction. A dashboard stays credible because the team understands the process behind it, not because a widget was configured once.
CLIENT WORK
These are examples of the CRM and process work that reporting depends on, not claims about a particular dashboard result.

Decidr
Decidr had sales and marketing activity split across Salesforce and HubSpot. We helped move the work into HubSpot as a shared CRM, with an in-house CRM manager owning the system after migration. That is the kind of source and ownership decision reporting relies on.
Read about the Salesforce migration
Super Property Solutions
The team described its old systems as “duct taped”. Our HubSpot implementation automated the sales process and saved time across the wider operation. A report can only reflect the sales work that people record in a system they use.
“Damien's expertise gave us immediate confidence. He transformed our 'duct taped' systems with a strategic HubSpot implementation that automated our sales process and saved our team a huge amount of time. We've seen significant improvements across sales, marketing, and operations as a result.”
David Johnson, Director, Super Property Solutions
Explore the client results
FLINTpro
Moving FLINTpro from Pipedrive to HubSpot meant delivering a CRM the team could use and onboarding to help them begin. A sales report needs that daily use to stay current.
“CLCK provided exceptional support in migrating our data from Pipedrive to HubSpot. Their expertise and attention to detail resulted in a ready-to-go, highly usable CRM, and their onboarding support was invaluable.”
Josh Shafer, VP Business Development, FLINTpro
Read about the Pipedrive migrationDASHBOARD VIEWS
Your team may need only a few of these. We'll choose them around the decisions, data quality and HubSpot features available to you.
See which deals make up the forecast, what assumptions sit behind it and where confidence is thin. A forecast should be a conversation about real opportunities, not a total without context.
See what's advancing, what has stopped and which next steps need an owner. This view can help a sales manager prepare for the next pipeline conversation.
Compare the enquiries and opportunities tied to each source, within the limits of the data actually captured. We won't dress an incomplete source history up as certainty.
Show where people move forward and where they fall out of the process. That only works when stage definitions and the dates used in the report are agreed.
Bring calls, meetings, emails and tasks into view so the team can spot missed follow-up. We check how activity is recorded before treating the count as a measure of effort.
Compare like with like where ownership, territory and segment data make that fair. If the underlying records differ, we start there rather than publish a misleading league table.
See whether enquiries get an owner, how long first contact takes and what happens next. That makes a vague handover problem easier to find and fix.
Bring the few numbers that change decisions into one place, with enough context to explain a movement or challenge a forecast. Not every chart belongs on the executive screen.
BUILD PROCESS
We keep the scope tied to the questions you need answered. That may be a focused reporting job or part of wider HubSpot work.
We look at the decisions people need to make and the reports they currently work around. We check which figures cause arguments, where the data comes from and what a good answer would let the team do.
We look at the fields, deal stages, source rules, ownership and activity capture behind each report. Some gaps can be cleaned up; others need better capture from now on. We'll distinguish the two.
We create a focused set of HubSpot reports and dashboards for the agreed questions, test them against real records and explain what each number includes. The exact features depend on your HubSpot setup and subscription.
We walk sales, marketing and leadership through their views and the habits that keep them accurate. When someone finds a confusing number, there's a way to trace it rather than give up on the report.
IMPLEMENTATION OR SUPPORT
If the data is sound, we may be able to focus on the dashboards. If the same structural problems keep feeding them, the answer is a bigger fix. When the business keeps changing, you may need someone to maintain the views with you.
RELATED SUPPORT
If you're choosing an agency or consultant before you know the reporting scope, start with the bigger partner decision.
Meet your HubSpot partnerCheck whether the next priority is more enquiries or fixing how the current ones move through your CRM.
Read the readiness guideUnderstand the scope and budget questions if reporting turns out to be part of a wider rebuild.
Read the cost guideSee how lead scoring fits with lifecycle, source, reporting and follow-up when the team wants to prioritise enquiries.
Read the scoring guideFAQS
Yes. CLCK helps Australian teams plan, fix, and build HubSpot sales reporting dashboards across pipeline, lifecycle, source, activity, attribution, handover, and leadership reporting. The work starts with the data and process behind the dashboard so the reports can be trusted.
Usually because the CRM inputs are inconsistent. Lifecycle stages, deal stages, owners, sources, activities, campaign tracking, and follow-up rules all affect reporting quality. If those rules are unclear, the dashboard will not hold up.
Sometimes. If the portal is already well structured, the work may be a focused dashboard and reporting project. If the data, stages, migration, automation, or adoption are messy, it should usually sit inside a broader HubSpot implementation or cleanup project.
Yes. Ongoing HubSpot support may fit when dashboards need regular review, new views, training, process changes, campaign reporting and adjustments after the first build.
No. HubSpot support is the right place for platform bugs, billing, access, or account issues. CLCK helps with the commercial setup around reporting, CRM structure, process, adoption, and the dashboards your team uses to make decisions.
Sometimes existing records can be cleaned or reclassified, but a dashboard cannot reconstruct information that was never captured. We'll show you what the data can answer today, what needs checking and what will improve when collection rules change.
A sales pipeline or forecast is not the same as invoiced revenue. We'll agree what each figure means and which system owns it. If finance reconciliation is part of the scope, we'll map the source data and connections before claiming the numbers match.
Not necessarily. If the records, stages and ownership are already consistent, a focused reporting project may be enough. If the same errors keep appearing in the data, we'll show you which underlying changes are worth making first.
NEXT STEP
Tell us which figures the team doesn't trust and what decisions they're meant to support. We'll help you work out whether the next step is a focused reporting project, CRM clean-up, implementation or ongoing help.